UK housing affordability under the spotlight: pressure points and untapped potential
Data Insights
Published by
PriceHubble
-
10 Sept 2025

UK housing affordability under the spotlight: pressure points and untapped potential
Data Insights
Published by
PriceHubble
-
10 Sept 2025
UK housing affordability under the spotlight: pressure points and untapped potential
Data Insights
Published by
PriceHubble
-
10 Sept 2025
Housing affordability remains one of the defining challenges of the UK housing market. Rising housing costs, limited housing supply, and the enduring cost-of-living crisis mean that many households are struggling to balance their budgets and find affordable housing options. Yet, our recent analysis shows that the story is more complex than the headlines suggest.
Our research focuses on the rental market and finds that while housing affordability stress is acute for many, a significant and growing cohort of high-earners are choosing to rent, spending a much smaller proportion of their income on rent. Both groups are potentially underserved by the range of options in the current rental market.
A divided picture of renter affordability
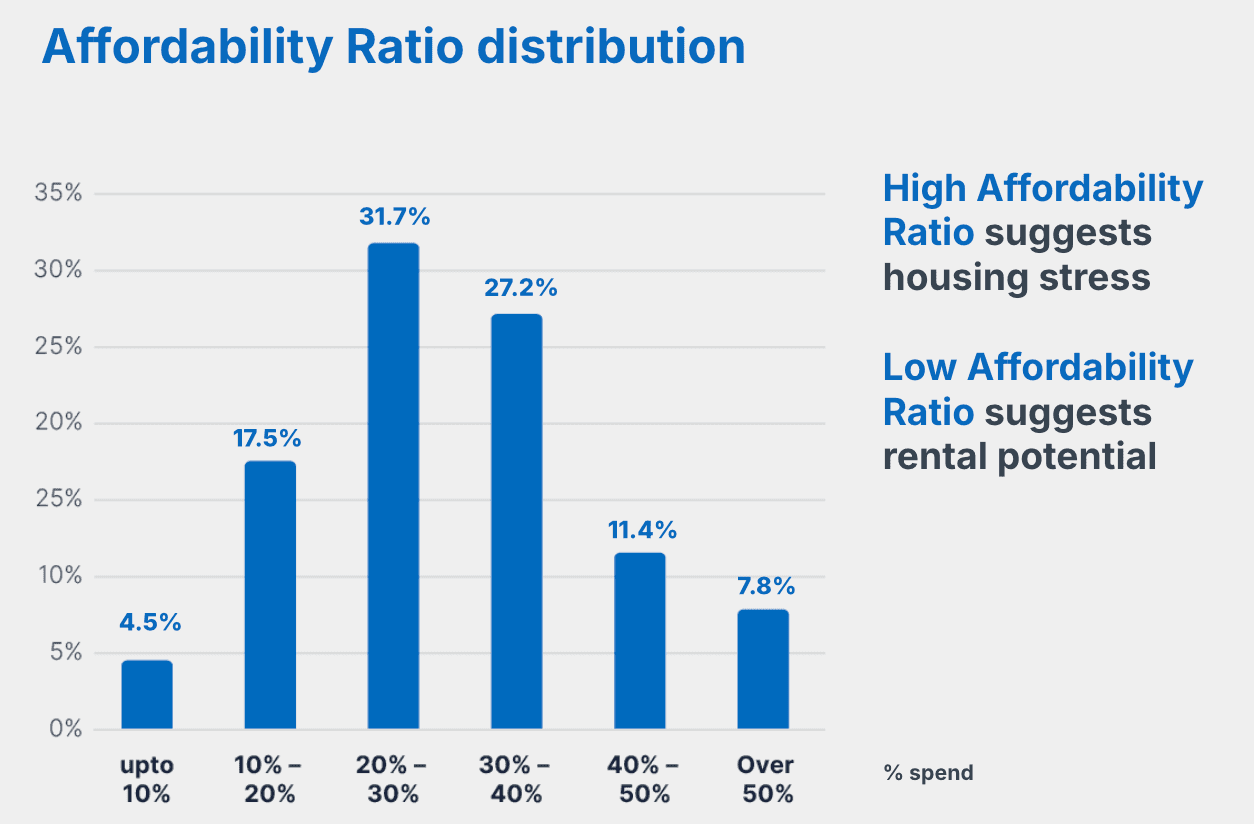
Our latest study, based on over 8 million rental records, shows that 21% of UK renting households spend more than 40% of their gross monthly household income on rent. These are households facing clear affordability stress – often medium to low-income families, young professionals, or those living in high-demand cities such as London, Brighton, and Edinburgh.
At the same time, 24% of UK renters spend less than 20% of their income on rent. This group is not only better positioned to withstand higher housing costs, but also represents a latent demand pool. With the right mix of quality, location and value, many could – and would – be likely to spend more on housing.
This divergence highlights why conventional affordability ratios (such as the 30% threshold) only tell part of the story. As Sandra Jones, Managing Director of PriceHubble UK, puts it: "Affordability metrics are key to understanding where housing stress is most acute and to identifying where there is the greatest opportunity to deliver more quality rental homes.”
Housing affordability remains one of the defining challenges of the UK housing market. Rising housing costs, limited housing supply, and the enduring cost-of-living crisis mean that many households are struggling to balance their budgets and find affordable housing options. Yet, our recent analysis shows that the story is more complex than the headlines suggest.
Our research focuses on the rental market and finds that while housing affordability stress is acute for many, a significant and growing cohort of high-earners are choosing to rent, spending a much smaller proportion of their income on rent. Both groups are potentially underserved by the range of options in the current rental market.
A divided picture of renter affordability
Our latest study, based on over 8 million rental records, shows that 21% of UK renting households spend more than 40% of their gross monthly household income on rent. These are households facing clear affordability stress – often medium to low-income families, young professionals, or those living in high-demand cities such as London, Brighton, and Edinburgh.
At the same time, 24% of UK renters spend less than 20% of their income on rent. This group is not only better positioned to withstand higher housing costs, but also represents a latent demand pool. With the right mix of quality, location and value, many could – and would – be likely to spend more on housing.
This divergence highlights why conventional affordability ratios (such as the 30% threshold) only tell part of the story. As Sandra Jones, Managing Director of PriceHubble UK, puts it: "Affordability metrics are key to understanding where housing stress is most acute and to identifying where there is the greatest opportunity to deliver more quality rental homes.”
Research
Spending limits: Using affordability metrics to assess rental market opportunities

Research
Spending limits: Using affordability metrics to assess rental market opportunities
Regional rental affordability contrasts
Affordability challenges are not uniform. Take two cities: Brighton and Leeds.
A household earning £50,000–£75,000 spends an average of 29% of its income on rent in Brighton (South East).
The same household spends just 21% in Leeds (West Yorkshire).
Both markets face affordability pressures for lower earners, but Leeds still offers more breathing room for middle-income renters. These differences are crucial for investors, local authorities, and Build-to-Rent (BTR) developers assessing where new developments are most viable.
Similarly contrasts can be observed elsewhere. As an example, Renters in London spend, on average, nearly 30% of their income on rent, making the capital one of the least affordable areas, compared to just under 21% in the North East. In Manchester (North West), renters spend on average 26% of their income on rent, while in Birmingham (West Midlands), the rental affordability ratio is 25% and in Liverpool, it is closer to 23%.

Our solution, Market Analyser, gives you instant access to local rental reports, heat maps, comparables, and key metrics such as renter demographics, average earnings and affordability metrics. It enables you to quickly assess opportunities in any UK housing market (including Wales and Scotland). Request a demo to learn more about Market Analyser:
Regional rental affordability contrasts
Affordability challenges are not uniform. Take two cities: Brighton and Leeds.
A household earning £50,000–£75,000 spends an average of 29% of its income on rent in Brighton (South East).
The same household spends just 21% in Leeds (West Yorkshire).
Both markets face affordability pressures for lower earners, but Leeds still offers more breathing room for middle-income renters. These differences are crucial for investors, local authorities, and Build-to-Rent (BTR) developers assessing where new developments are most viable.
Similarly contrasts can be observed elsewhere. As an example, Renters in London spend, on average, nearly 30% of their income on rent, making the capital one of the least affordable areas, compared to just under 21% in the North East. In Manchester (North West), renters spend on average 26% of their income on rent, while in Birmingham (West Midlands), the rental affordability ratio is 25% and in Liverpool, it is closer to 23%.
Our solution, Market Analyser, gives you instant access to local rental reports, heat maps, comparables, and key metrics such as renter demographics, average earnings and affordability metrics. It enables you to quickly assess opportunities in any UK housing market (including Wales and Scotland). Request a demo to learn more about Market Analyser:
Real Rental Potential: a key to understanding housing affordability pressures and opportunities
A central part of our analysis is the concept of Real Rental Potential. Instead of assuming all renters will spend 30% of their income on housing, this method adjusts for actual renter behaviour.
In London, for example:
If all renting households spent 30% of their income on rent, the market for homes above £2,500 per month would be 47% larger than current transactions suggest.
In reality, many higher earners allocate far less to rent, creating an “affordability ceiling.” Even so, the market could realistically support 25% more households at this level than it does today.
This matters because understanding affordability ceilings helps avoid overestimating demand at the top end of the rented sector, while also revealing overlooked opportunities in the middle of the market – households sometimes squeezed between affordable housing provision and the high costs of home ownership or rental.
Why affordability is more than a limit
It’s tempting to treat affordability as a rigid constraint. But the evidence shows renters stretch their budgets when the trade-offs make sense – whether that’s living close to work, securing better schools, or accessing strong transport links.
Equally, renters who spend below 20% of income on housing are not necessarily frugal. Some may be saving for deposits to become first-time buyers, some prioritise travel or childcare, and others simply haven’t yet found a product that justifies higher spending.
Affordability data, then, is not just about limits – it’s a signal. It tells us where households are over-stretched, where they have untapped capacity, and what trade-offs they are willing to make. For property professionals, but also for local authorities, these insights are essential in aligning new supply with real-world demand and addressing the housing crisis.
Implications for investors, developers and local authorities
The findings have clear implications for housing policy and investment strategy:
For investors and developers: the greatest opportunities may lie not at the premium end, but in the underserved middle-income segment – households earning £40,000–£70,000, too stretched for homeownership yet often overlooked in new housing delivery.
For local authorities and central government (gov.uk): affordability ratios should inform where support for affordable homes and social housing is most urgent.
A new lens on housing affordability
The UK faces an ongoing housing crisis. Average house prices, interest rates and mortgage payments, often still high relative to annual earnings, keep home ownership out of reach for many. Understanding this landscape requires more than just tracking the house price index or median house price from the Land Registry. It requires detailed and hyper local affordability metrics that capture how households actually behave.
That’s why we have developed Market Analyser, a platform that provides real-time insights into affordability ratios, earnings data, and renter demographics for any UK housing market, at both national and local levels. Our affordability data is published on a monthly basis by the Office for National Statistics, and trusted by major media outlets in the UK.
Looking ahead: Housing affordability challenges and opportunities
As the post-pandemic surge in rents eases and house price growth moderates, the focus will shift from rapid expansion to precise alignment: matching property prices to incomes, locations to demand, and rent levels to real affordability.
The lesson is clear: housing affordability, and more specifically rental affordability, is not just a problem to be solved. It’s a compass, pointing policymakers, developers, and investors toward both the stress points and the opportunities shaping the future of the UK housing market.
See also

News
Read more →

News
Read more →

News
Read more →
Request a demo
We will get back to you quickly.
We look forward to speaking with you.
Thank you!
We will get back to you within 24 business hours.

Thank you!
We will get back to you within 24 business hours.