How to make optimal BTR decisions: 5 questions you should be able to answer
Data Insights
Published by
PriceHubble
-
3 Sept 2025

How to make optimal BTR decisions: 5 questions you should be able to answer
Data Insights
Published by
PriceHubble
-
3 Sept 2025
How to make optimal BTR decisions: 5 questions you should be able to answer
Data Insights
Published by
PriceHubble
-
3 Sept 2025
Planning a new Build-to-Rent development? Testing the viability of an investment? Or refining your rental strategy in a competitive market? Success depends on having the right answers to a handful of critical questions: Who are your renters? Can they afford your target rents? How deep is the demand pool?
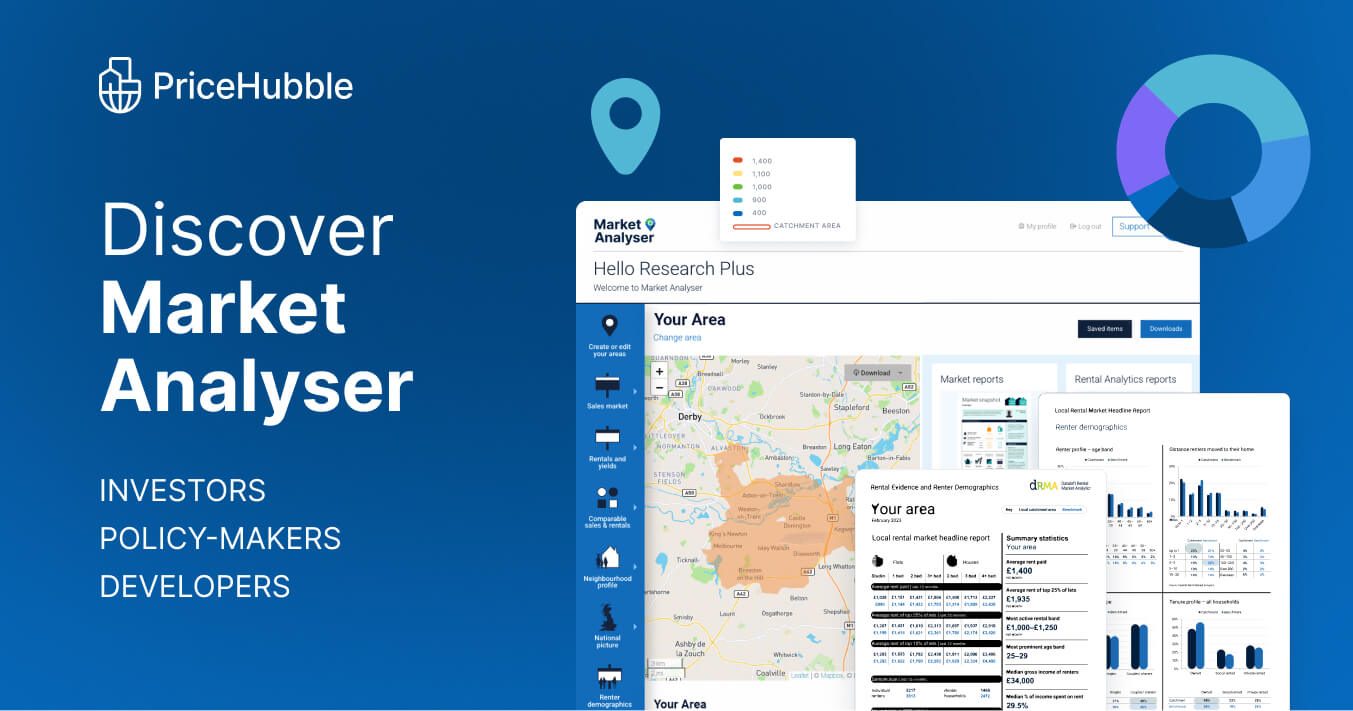
These are not just nice-to-know. They are the difference between a scheme that thrives and one that doesn’t. Yet too often, answering them relies on outdated or incomplete data, manual spreadsheets, or assumptions that don’t stand up to investor scrutiny.That’s why we built Market Analyser: a platform that gives you instant access to analytics on sales and rental markets for any local market, with a wide range of affordability metrics, renter demographics, in-depth local rental reports, heat maps and comparables. With it, you can answer the five questions that matter most – in minutes, not months.
Planning a new Build-to-Rent development? Testing the viability of an investment? Or refining your rental strategy in a competitive market? Success depends on having the right answers to a handful of critical questions: Who are your renters? Can they afford your target rents? How deep is the demand pool?
These are not just nice-to-know. They are the difference between a scheme that thrives and one that doesn’t. Yet too often, answering them relies on outdated or incomplete data, manual spreadsheets, or assumptions that don’t stand up to investor scrutiny.That’s why we built Market Analyser: a platform that gives you instant access to analytics on sales and rental markets for any local market, with a wide range of affordability metrics, renter demographics, in-depth local rental reports, heat maps and comparables. With it, you can answer the five questions that matter most – in minutes, not months.
Question 1: What is the typical renter profile in my market?
Knowing your renter profile is the foundation of every BTR strategy. Is your audience predominantly young professionals, families, or sharers? What are their income levels, and which employment sectors do they work in?
Question 1: What is the typical renter profile in my market?
Knowing your renter profile is the foundation of every BTR strategy. Is your audience predominantly young professionals, families, or sharers? What are their income levels, and which employment sectors do they work in?
Question 1: What is the typical renter profile in my market?
Knowing your renter profile is the foundation of every BTR strategy. Is your audience predominantly young professionals, families, or sharers? What are their income levels, and which employment sectors do they work in?
Why it matters:
Ensures your unit mix and amenities match demand.
Guides marketing campaigns and leasing strategies.
Identifies risks if your scheme is misaligned with the local demographic.
Why it matters:
Ensures your unit mix and amenities match demand.
Guides marketing campaigns and leasing strategies.
Identifies risks if your scheme is misaligned with the local demographic.
Why it matters:
Ensures your unit mix and amenities match demand.
Guides marketing campaigns and leasing strategies.
Identifies risks if your scheme is misaligned with the local demographic.
With Market Analyser, you can instantly see the breakdown of renters by age, household type, income band, employment sector, and workplace location.
Example: If 40% of renters in your target area are aged 25–34 and have average incomes of £35–50k, you know exactly how to position your product.
With Market Analyser, you can instantly see the breakdown of renters by age, household type, income band, employment sector, and workplace location.
Example: If 40% of renters in your target area are aged 25–34 and have average incomes of £35–50k, you know exactly how to position your product.
With Market Analyser, you can instantly see the breakdown of renters by age, household type, income band, employment sector, and workplace location.
Example: If 40% of renters in your target area are aged 25–34 and have average incomes of £35–50k, you know exactly how to position your product.
Question 2: Is there evidence to support my target rent?
Setting rents too high risks long voids, and setting them too low leaves money on the table. The key is to understand whether renters in your market can afford your target rent, and whether similar rents are already being achieved locally.
Question 2: Is there evidence to support my target rent?
Setting rents too high risks long voids, and setting them too low leaves money on the table. The key is to understand whether renters in your market can afford your target rent, and whether similar rents are already being achieved locally.
Question 2: Is there evidence to support my target rent?
Setting rents too high risks long voids, and setting them too low leaves money on the table. The key is to understand whether renters in your market can afford your target rent, and whether similar rents are already being achieved locally.
Why it matters:
Determines scheme viability and lender confidence.
Protects against affordability concerns and regulatory scrutiny.
Supports pricing strategies in the lease-up phase.
Why it matters:
Determines scheme viability and lender confidence.
Protects against affordability concerns and regulatory scrutiny.
Supports pricing strategies in the lease-up phase.
Why it matters:
Determines scheme viability and lender confidence.
Protects against affordability concerns and regulatory scrutiny.
Supports pricing strategies in the lease-up phase.
With Market Analyser, you can:
Analyse the distribution of rents by property size and type.
Benchmark your target rent against top quartile/decile rents in the area.
Cross-check against renter incomes to calculate affordability (e.g. % of renters who could pay your target rent at 30% of gross income).
Expand the analysis to wider commuter zones to capture additional demand.
Example: You’re planning 1-bed units at £1,450 pcm. Market Analyser shows that 28% of local renters earn enough to afford this level, and comparable 1-beds have already achieved £1,500 in the past 12 months. That’s the evidence you need to justify your rent levels.

Question 3: How big is my Total Addressable Market (TAM)?
Every scheme needs to know whether demand is deep enough to absorb new supply. Knowing that some renters can afford your units is not enough; you need to quantify the total pool of demand.
With Market Analyser, you can:
Analyse the distribution of rents by property size and type.
Benchmark your target rent against top quartile/decile rents in the area.
Cross-check against renter incomes to calculate affordability (e.g. % of renters who could pay your target rent at 30% of gross income).
Expand the analysis to wider commuter zones to capture additional demand.
Example: You’re planning 1-bed units at £1,450 pcm. Market Analyser shows that 28% of local renters earn enough to afford this level, and comparable 1-beds have already achieved £1,500 in the past 12 months. That’s the evidence you need to justify your rent levels.
Question 3: How big is my Total Addressable Market (TAM)?
Every scheme needs to know whether demand is deep enough to absorb new supply. Knowing that some renters can afford your units is not enough; you need to quantify the total pool of demand.
Why it matters:
Underpins investment and financial modelling.
Demonstrates absorption capacity for larger BTR schemes.
Allows you to assess competition risk in pipeline-heavy areas.
Why it matters:
Underpins investment and financial modelling.
Demonstrates absorption capacity for larger BTR schemes.
Allows you to assess competition risk in pipeline-heavy areas.
Why it matters:
Underpins investment and financial modelling.
Demonstrates absorption capacity for larger BTR schemes.
Allows you to assess competition risk in pipeline-heavy areas.
With Market Analyser, you can:
Define your target renter (e.g. aged 25–34, income £35–50k).
Calculate the share of local renters who meet these criteria.
Translate that into absolute numbers, based on total PRS households and turnover per year.
Compare TAM against the number of units in your pipeline.
Example: Your scheme has 200 units. Market Analyser shows 8,000 renters locally meet your income and age criteria, with an annual turnover of 1,500 lettings. You now have confidence that the scheme can be absorbed without oversupply risk.
Question 4: How big is the pool of key workers in this location?
Key workers are increasingly seen as a stabilising force in the rental market. Their steady demand provides resilience during economic downturns and supports ESG-linked investment strategies.
Why it matters:
Attracts impact-driven and ESG-conscious investors.
Ensures stable occupancy and reduced risk during recessions.
Supports policy discussions with local authorities.
Why it matters:
Attracts impact-driven and ESG-conscious investors.
Ensures stable occupancy and reduced risk during recessions.
Supports policy discussions with local authorities.
Why it matters:
Attracts impact-driven and ESG-conscious investors.
Ensures stable occupancy and reduced risk during recessions.
Supports policy discussions with local authorities.
With Market Analyser, you can:
Use income or employment sector as a proxy for key workers.
Identify the proportion of renters working in healthcare, education, retail or public services.
Estimate how many lettings per year come from this group.
Example: In a regional city, Market Analyser highlights that 22% of renters are in education or healthcare, equating to 700 lettings annually. That gives you confidence that your scheme will benefit from a resilient tenant base.
Question 5: Can I expect to attract renters from outside the local area?
Migration and commuting patterns are essential to understanding the true demand pool. Many BTR schemes attract renters who move from neighbouring towns or commute to employment hubs.
Question 5: Can I expect to attract renters from outside the local area?
Migration and commuting patterns are essential to understanding the true demand pool. Many BTR schemes attract renters who move from neighbouring towns or commute to employment hubs.
Question 5: Can I expect to attract renters from outside the local area?
Migration and commuting patterns are essential to understanding the true demand pool. Many BTR schemes attract renters who move from neighbouring towns or commute to employment hubs.
With Market Analyser, you can:
Map where renters have moved from, and where they commute to work.
Filter by age and income to see the profile of movers.
Identify hotspots to target marketing campaigns.
Example: A scheme in South London finds that 30% of renters have moved in from Clapham and Wandsworth, and 45% commute into central London. This shows that even if local incomes are constrained, the catchment area provides a strong demand pool.
Making data-driven BTR decisions with instant access to key insights
BTR is a data-driven business. But until recently, accessing reliable data meant endless spreadsheets, fragmented sources, and guesswork. Market Analyser changes that, bringing together millions of data points across sales, rentals and demographics into one powerful platform.
Whether you’re assessing feasibility, setting rents, or refining your marketing strategy, the five questions above are critical. With Market Analyser, you can answer them instantly – with confidence.
Ready to see how Market Analyser can help you?
See also

News
Read more →

News
Read more →

News
Read more →
Request a demo
We will get back to you quickly.
We look forward to speaking with you.
Request a demo
We will get back to you quickly.
We look forward to speaking with you.
Thank you!
We will get back to you within 24 business hours.

Thank you!
We will get back to you within 24 business hours.

Dataloft has now merged with PriceHubble.com