A more tailored view of the market in Property Advisor
Product Updates
Published by
PriceHubble
-
A more tailored view of the market in Property Advisor
Product Updates
Published by
PriceHubble
-
A more tailored view of the market in Property Advisor
Product Updates
Published by
PriceHubble
-
Prove it, don't just feel it
A client wants to list at a price you quietly know is ambitious. You can feel it, but feeling it isn't enough. To move them, you need to show them where that price sits against everything else on the market right now, in a way they can see for themselves.
The revamped Market Trends module in Property Advisor is built for exactly that. It takes the market picture you'd otherwise piece together by hand and lays it out so you can see, in seconds, whether an asking price is safe or a stretch. Here's what's changed.
See the whole market without piecing it together
The new module organises everything into three tabs instead of one long view: Trends, Distributions and Positioning. Each one answers a different question, so you can go straight to the insight you need.
Trends shows how asking and achieved median prices, price per square metre and time on market have moved recently.
Distributions shows where the market sits as a whole, displaying the number of properties on the market by different categories: asking and sold price band, time on market, living area and number of rooms.
Positioning is entirely new, and shows how the property compares directly against the listings competing with it.
Positioning tab: Know precisely which listings you're up against
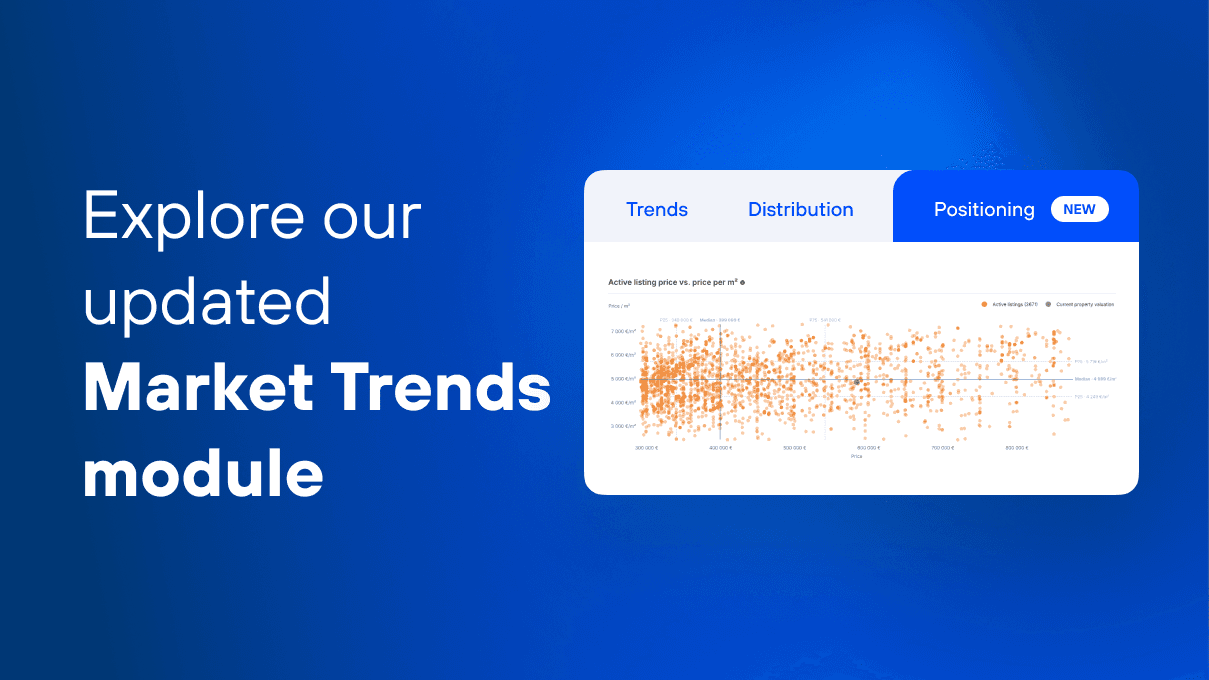
The most useful addition is in the Positioning tab. Two new scatter charts plot every active listing in the local market against the property you're assessing, so you can see precisely who it's competing with:
Price versus price per square metre, showing whether active listings are priced above or below the property on a like-for-like basis.
Living area versus price, showing how the property's size and price compare with similarly sized listings currently on the market.
Both charts clearly mark the property's valuation among the surrounding listings, and P25, median and P75 lines sit right on the chart too, so you can see instantly whether an asking price is ambitious or safe, not something you need to calculate yourself.
Plus: the property's valuation, now visible on every chart
There's also a smaller change with a big impact: the current property valuation now appears directly on every relevant chart under the Trends and Distributions tabs, not just in Positioning. Wherever you're looking, you can immediately see how the property compares with the broader market, rather than having to hold two numbers in your head at once.
Why this matters: Less time assembling evidence, more time using it
Together, these updates make it much easier to build a rounded view of a property's market position. You can now see even more clearly how the market has moved, how the property sits within the overall distribution, and, now, exactly which active listings it's really competing against.
As part of Seed, Signal, Sell, Property Advisor is what helps a mandate close. It's what gives you the confidence to walk into a client meeting with real insight on the property at hand, make the case for the right price against what's actually happening in the market, and back it up with evidence agent and owner can both see for themselves. The new Positioning tab takes that confidence a step further, showing exactly where the property sits against everything else it's competing with.
That's less time piecing together evidence from separate views, and more time using it to close.
Try it today
The new Market Trends module update is available now in Property Advisor. Open Market Trends in Property Advisor, and you'll see it. Head straight to the Positioning tab to explore it for yourself.
Prove it, don't just feel it
A client wants to list at a price you quietly know is ambitious. You can feel it, but feeling it isn't enough. To move them, you need to show them where that price sits against everything else on the market right now, in a way they can see for themselves.
The revamped Market Trends module in Property Advisor is built for exactly that. It takes the market picture you'd otherwise piece together by hand and lays it out so you can see, in seconds, whether an asking price is safe or a stretch. Here's what's changed.
See the whole market without piecing it together
The new module organises everything into three tabs instead of one long view: Trends, Distributions and Positioning. Each one answers a different question, so you can go straight to the insight you need.
Trends shows how asking and achieved median prices, price per square metre and time on market have moved recently.
Distributions shows where the market sits as a whole, displaying the number of properties on the market by different categories: asking and sold price band, time on market, living area and number of rooms.
Positioning is entirely new, and shows how the property compares directly against the listings competing with it.
Positioning tab: Know precisely which listings you're up against
The most useful addition is in the Positioning tab. Two new scatter charts plot every active listing in the local market against the property you're assessing, so you can see precisely who it's competing with:
Price versus price per square metre, showing whether active listings are priced above or below the property on a like-for-like basis.
Living area versus price, showing how the property's size and price compare with similarly sized listings currently on the market.
Both charts clearly mark the property's valuation among the surrounding listings, and P25, median and P75 lines sit right on the chart too, so you can see instantly whether an asking price is ambitious or safe, not something you need to calculate yourself.
Plus: the property's valuation, now visible on every chart
There's also a smaller change with a big impact: the current property valuation now appears directly on every relevant chart under the Trends and Distributions tabs, not just in Positioning. Wherever you're looking, you can immediately see how the property compares with the broader market, rather than having to hold two numbers in your head at once.
Why this matters: Less time assembling evidence, more time using it
Together, these updates make it much easier to build a rounded view of a property's market position. You can now see even more clearly how the market has moved, how the property sits within the overall distribution, and, now, exactly which active listings it's really competing against.
As part of Seed, Signal, Sell, Property Advisor is what helps a mandate close. It's what gives you the confidence to walk into a client meeting with real insight on the property at hand, make the case for the right price against what's actually happening in the market, and back it up with evidence agent and owner can both see for themselves. The new Positioning tab takes that confidence a step further, showing exactly where the property sits against everything else it's competing with.
That's less time piecing together evidence from separate views, and more time using it to close.
Try it today
The new Market Trends module update is available now in Property Advisor. Open Market Trends in Property Advisor, and you'll see it. Head straight to the Positioning tab to explore it for yourself.
Prove it, don't just feel it
A client wants to list at a price you quietly know is ambitious. You can feel it, but feeling it isn't enough. To move them, you need to show them where that price sits against everything else on the market right now, in a way they can see for themselves.
The revamped Market Trends module in Property Advisor is built for exactly that. It takes the market picture you'd otherwise piece together by hand and lays it out so you can see, in seconds, whether an asking price is safe or a stretch. Here's what's changed.
See the whole market without piecing it together
The new module organises everything into three tabs instead of one long view: Trends, Distributions and Positioning. Each one answers a different question, so you can go straight to the insight you need.
Trends shows how asking and achieved median prices, price per square metre and time on market have moved recently.
Distributions shows where the market sits as a whole, displaying the number of properties on the market by different categories: asking and sold price band, time on market, living area and number of rooms.
Positioning is entirely new, and shows how the property compares directly against the listings competing with it.
Positioning tab: Know precisely which listings you're up against
The most useful addition is in the Positioning tab. Two new scatter charts plot every active listing in the local market against the property you're assessing, so you can see precisely who it's competing with:
Price versus price per square metre, showing whether active listings are priced above or below the property on a like-for-like basis.
Living area versus price, showing how the property's size and price compare with similarly sized listings currently on the market.
Both charts clearly mark the property's valuation among the surrounding listings, and P25, median and P75 lines sit right on the chart too, so you can see instantly whether an asking price is ambitious or safe, not something you need to calculate yourself.
Plus: the property's valuation, now visible on every chart
There's also a smaller change with a big impact: the current property valuation now appears directly on every relevant chart under the Trends and Distributions tabs, not just in Positioning. Wherever you're looking, you can immediately see how the property compares with the broader market, rather than having to hold two numbers in your head at once.
Why this matters: Less time assembling evidence, more time using it
Together, these updates make it much easier to build a rounded view of a property's market position. You can now see even more clearly how the market has moved, how the property sits within the overall distribution, and, now, exactly which active listings it's really competing against.
As part of Seed, Signal, Sell, Property Advisor is what helps a mandate close. It's what gives you the confidence to walk into a client meeting with real insight on the property at hand, make the case for the right price against what's actually happening in the market, and back it up with evidence agent and owner can both see for themselves. The new Positioning tab takes that confidence a step further, showing exactly where the property sits against everything else it's competing with.
That's less time piecing together evidence from separate views, and more time using it to close.
Try it today
The new Market Trends module update is available now in Property Advisor. Open Market Trends in Property Advisor, and you'll see it. Head straight to the Positioning tab to explore it for yourself.
See also

News
Read more →

News
Read more →

News
Read more →
Request a demo
We will get back to you quickly.
We look forward to speaking with you.
Thank you!
We will get back to you within 24 business hours.

Thank you!
We will get back to you within 24 business hours.